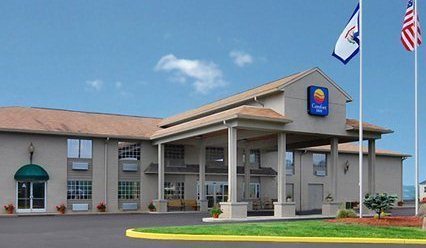
Hotels are operating businesses housed within commercial real estate boxes. As such, their value is based on the revenue and profit earned by the business, and fluctuates accordingly.
Hotel values dropped precipitously following the start of the recession in Q4 2008 with cutbacks in corporate, group and leisure travel. Hotels responded by slashing their rates in order to compete for what little business was available.
Since 2010, recovery has been steady but slow, driven first by occupancy improvements, followed by room rate increases. Initially, the greatest improvements in both occupancy and average daily room rates (ADR) was seen in the luxury segment. In 2012, upper mid-scale and upscale enjoyed the greatest increase in rooms sold. Regionally, the West South Central and Pacific had the highest growth in rooms sold, year over year. Some markets, notably Manhattan, have seen dramatic demand improvements, which has spurred a hotel building boom there.
In most markets, supply growth has been constrained by limited availability of financing. According to Smith Travel Research, for the trailing 12 months through November 2012 supply is up 0.4% while demand increased by 3%. That’s a great dynamic for the industry that has translated into an increased Revenue Per Available Room (RevPAR) of 6.8%.
For the 2012 year to date through November, performance for in the hospitality market in the United States was as follows:
|
Occupancy |
Average room rate |
RevPAR |
|||
| 2012 | 2011 | 2012 | 2011 | 2012 | 2011 |
| 62.6% | 61.1% | $106.23 | $101.98 | $66.47 | $62.27 |
Hotel transaction volume was down 25% in Q3 but looks to be up 25% in Q4 compared to last year, driven by large portfolio transactions. On an individual property basis, sales volume was flat, according to Real Capital Analytics.
Cap rates for hotels have held around 7.6%, down from 9.5% in 2009. Full service hotels traded on average at 7.2%, while limited service hotels traded at 8.6% cap rates.
Average price per room was $164,015 for full service and $64,233 for limited service. There continues to be strong buyer demand for deeply discounted distress opportunities, while publicly traded REITs focus on major markets: seeing acquisitions in non-core markets as diluting the value.
In their 2013 outlook, hoteliers are less optimistic than in 2012. They see top line growth slowing with resistance to rate increases, while operating costs will increase at a faster rate than revenue, thereby putting pressure on profitability. In addition, the brands, which have shown patience and flexibility during the recession, are expected to tighten up on Quality Assurance standards and Property Improvement Plans (PIPs) associated with license renewals and hotel sales.
We expect that many hotel owners who struggled to hold on through the recession and benefited during recovery, will decide to sell in 2013 in light of anticipated slowing profits and before pent up buyer demand abates. This should bode well for brokered transactions in the hospitality arena.
Report submitted by:
Tom Hamm, Hospitality Council Chair, Sperry Van Ness/Hamm & Co., Stamford, CT
*All Sperry Van Ness offices are independently owned and operated.
