
Retail Market Outlook
Stronger Economy and Job Trends Drive Retail Outlook
Retail property investors have waited patiently for signs of  momentum in the sector’s otherwise prodding recovery. Over the next year, many of those investors will see their patience rewarded. A stronger consumer and a healthy uptick in lease signings, a dearth of new supply, and a growing appreciation for shoppers’ changing tastes are poised to lift occupancy rates and rents for well-located, well-tenanted, and well-managed properties. Risks remain, most clearly from shoppers’ substitution into online commerce for an ever-widening range of quickly delivered products. In managing those risks, the shift to destination “shop and play” retail models — and the emergence of new models including urban outlet centers — are taking on new urgency as competition for consumer dollars intensifies.
Improving Fundamentals and Investment Opportunities
Vacancy rates at neighborhood and community shopping centers extended their slow decline, falling 20 basis points in 2014 to 10.5 % for mortgage-financed properties tracked by Chandan Economics. Data from the International Council of Shopping Centers (ICSC) and the National Council of Real Estate Investment Fiduciaries (NCREIF) show even stronger trends, with shopping center vacancy rates falling to 7.3% at the end of last year, the lowest level in more than six years, since the early days of the recession. Mall performance proved that traditional retail models are far from obsolete; vacancy rates fell to a 27-year low of 5.8%, while asking rents registered double-digit increases.
As compared to apartments and central business district office buildings, where values have surpassed their pre-crisis peaks, retail cap rate spreads remain elevated across a wide spectrum of neighborhood and community shopping centers. Investors in the small- and mid-cap segments of these retail markets are not yet faced with a shortfall of secondary market properties trading at discounts to fundamental value. Even as prices rise for stabilized assets, the investment opportunity set may grow over the next two years as billions of dollars of mortgages bundled into pre-crisis commercial mortgage-backed securities (CMBS) come due. Smaller retail properties are overrepresented in those maturities and will stretch the market’s refinancing capacity, favoring cash-rich investors with the capacity to recapitalize distressed borrowers.
Grocery-anchored centers and retail net lease properties with credit tenants and long remaining lease terms are proving more challenging spaces for investors in search of discounts. The bond-like characteristics of the latter allowed them to emerge as investor favorites in the aftermath of the recession. Buyers now cite a dearth of product in the market as a source of frustration and upward pressure on prices. Even as investors have migrated to riskier products, bank branches, the stronger national pharmacy chains, and quick-service fast-food establishments have seen cap rate spreads fall substantially lower than historic norms for net lease assets. Investors should be cautious in gauging the possibility of disruptions in safe haven tenant classes. In the grocery space, online retailers that have failed thus far to penetrate the market are watching Amazon Fresh for insights into shoppers’ willingness to try new things. Needless to say, traditional grocery owners and their landlords are watching closely as well.

Retail Market Statistics in 2015
Back to Work and Back to the Mall
At the heart of the improving retail picture, the labor market has improved substantially over the last year. Employers added more than 3 million jobs in 2014, the strongest performance since 1999. The unemployment rate, admittedly an imperfect measure of labor market health, fell to 5.6% at the end of the year, the lowest level since mid-2008. Even though early 2015 job numbers have been softer and labor participation remains depressed, the overall trends reflect an important dynamic in the job market. The rate at which businesses are hiring is trending toward normal levels; more important, the rate at which workers are voluntarily quitting their jobs, an indicator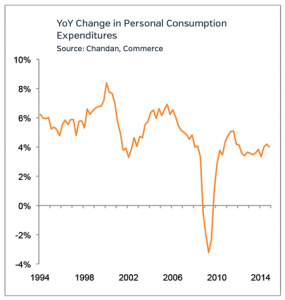 of their prospects in the job market, is also on the upswing.
Even as the headline job numbers improve, growth in wages remains sluggish. Among the countervailing forces putting money back in consumers’ pocketbooks, spending on debt service fell below 10% of disposable personal income during the fourth quarter of 2014. More recently, Americans have been spending less on their gas and oil heating bills, a net positive for the economy even though energy markets like Houston and Oklahoma City have suffered. In terms of headwinds, a larger share of renter households’ income is going to housing costs as apartment rent growth continues to outpace wages. Households are spending more on consumer goods in any case, driving year-over-year increases in personal consumption expenditures on the order of 4% in late 2014 and 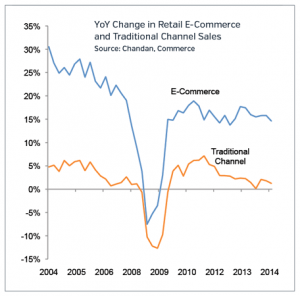 early 2015.
Brick-and-mortar retailers will have to work harder to capture their share of new spending, whether through enhancements to the tangible in-store experience or the development of truly effective omnichannel strategies. Online retail spending growth has increasingly outpaced traditional retail channels, growing year-over-year by nearly 15% in the fourth quarter of 2014. In contrast, retail spending excluding e-commerce increased by only 1.2%.
Construction Remains in Check
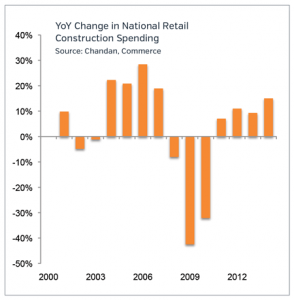
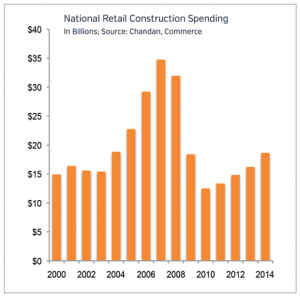
Investment in new retail space remains subdued as compared to pre-crisis peaks. Retail property development spending increased to $18.6 billion in 2014, up to 15% from a year earlier, but barely more than half its 2007 level. Factoring also for the rising cost of construction, the tally of projects underway across neighborhood and community shipping centers, big box retailers, and shopping malls is still early in its recovery.
New project announcements will be increasingly frequent in 2015, with an emphasis on growing and under-amenitized residential neighborhoods and malls that can effectively meet the “shop and play” paradigm. Difficulties in obtaining financing for smaller projects will persist as constraints over this cycle, particularly as heightened regulatory capital requirements at banks come into effect.
Rent Growth Improves Slowly
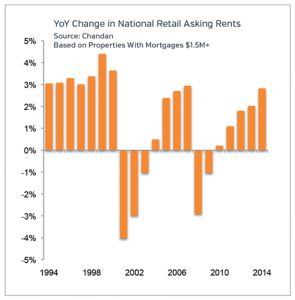
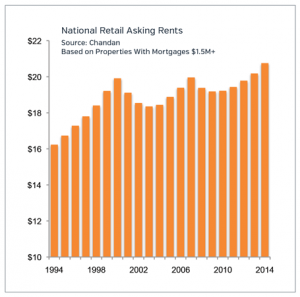
Measured across all property subtypes, retail rents are rising slowly but consistently. Average asking rents increased by 2.8% in 2014 according to Chandan Economics’ tracking of mortgage-financed properties, improving on the prior year’s 2 % increase. The aggregate numbers mask wide differences across geography and subtype. Dominant superregional malls and urban street-front retail have seen relatively larger increases; setting the bar, Fifth Avenue below Central Park in Manhattan is now, at roughly $3,400 per square foot, the most expensive retail corridor in the world.
Measures from ICSC and NCREIF show stronger trends than themortgage data. Shopping center rents increased by 6.5% in 2014, the best result since 2008. For malls, base rents increased by 17.2%, the fastest pace in the 14 years of available history. Mall net operating income (NOI) registered an exceptional year-over-year increase of 21.3%.
Cap Rates Have Room to Decline
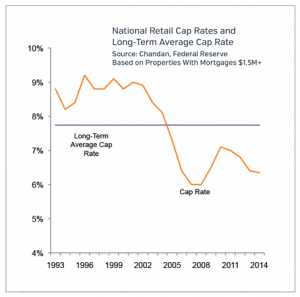
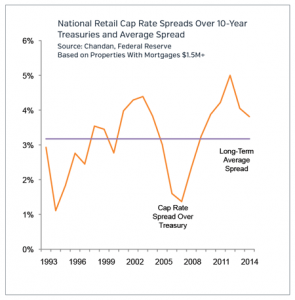
Well below its long-term average of 7.7%, the national average cap rate across all retail property types declined by less than 10 basis points during 2014, to just under 6.4%. Values increased even though cap rates were relatively flat, as improving rents and occupancy rates more than offset higher expenses. As compared to its long-term average of 320 basis points, cap rate spreads over ten-year Treasury yields held onto an additional cushion of 60 basis points. The largest regional malls commanded cap rates below 5 %, as did high street retail in gateway cities. Neighborhood and community shopping center cap rates trended between 7.0% 7.5% during 2014.
 While the impact of e-commerce on retailers has varied dramatically across product types, there is no segment of the market that is fully immune to the fundamental changes in the way Americans shop. Properties that are perceived as more resilient to substitution out of brick-and-mortar, including the most urban locations and grocery- and pharmacy-anchored properties, commanded a larger price premium and lower cap rates in 2014. That divergence in retail property values may narrow in 2015 as a better job market and rising discretionary spending lift some weaker segments of the market.
Markets to Watch
Not the largest or the most actively contested markets, the 2015 Retail Markets to Watch are each at an important juncture that presents unique opportunities for investment. Together, they reflect the diversity of trends that is driving the economy and commercial real estate performance in markets across the country.
Download the full report here. 
Market Cap Rates
Across all retail subtypes, the national average cap rate on mortgage-financed property sales was 6.4% in 2014, well below the 20-year average of 7.7%. Cap rates reflect historically low Treasury yields and spreads that remain elevated as compared to long-term norms. Across markets, cap rates for anchored shopping centers ranged from 8.1% in Detroit to 6% in the Bay Area. In gateway markets, cap rates for high street retail reflect aggressive bidding by domestic and foreign buyers. Driven by property trades along their major tourist corridors, San Francisco and Manhattan boasted high street retail cap rates of 4% and 3.9%, respectively, on par with the best-positioned apartment and office buildings.
It’s a different world out there.
It requires a different kind of commercial real estate firm working on your behalf in order to be successful. The Lipsey Company has ranked the Sperry Van Ness® organization as one of the most recognized commercial real estate brands in the US for a reason — we know how to deliver a certainty of execution for our clients. Sperry Van Ness International Corporation is one of the largest commercial real estate franchisors, with more than 190 locations in 500+ markets.